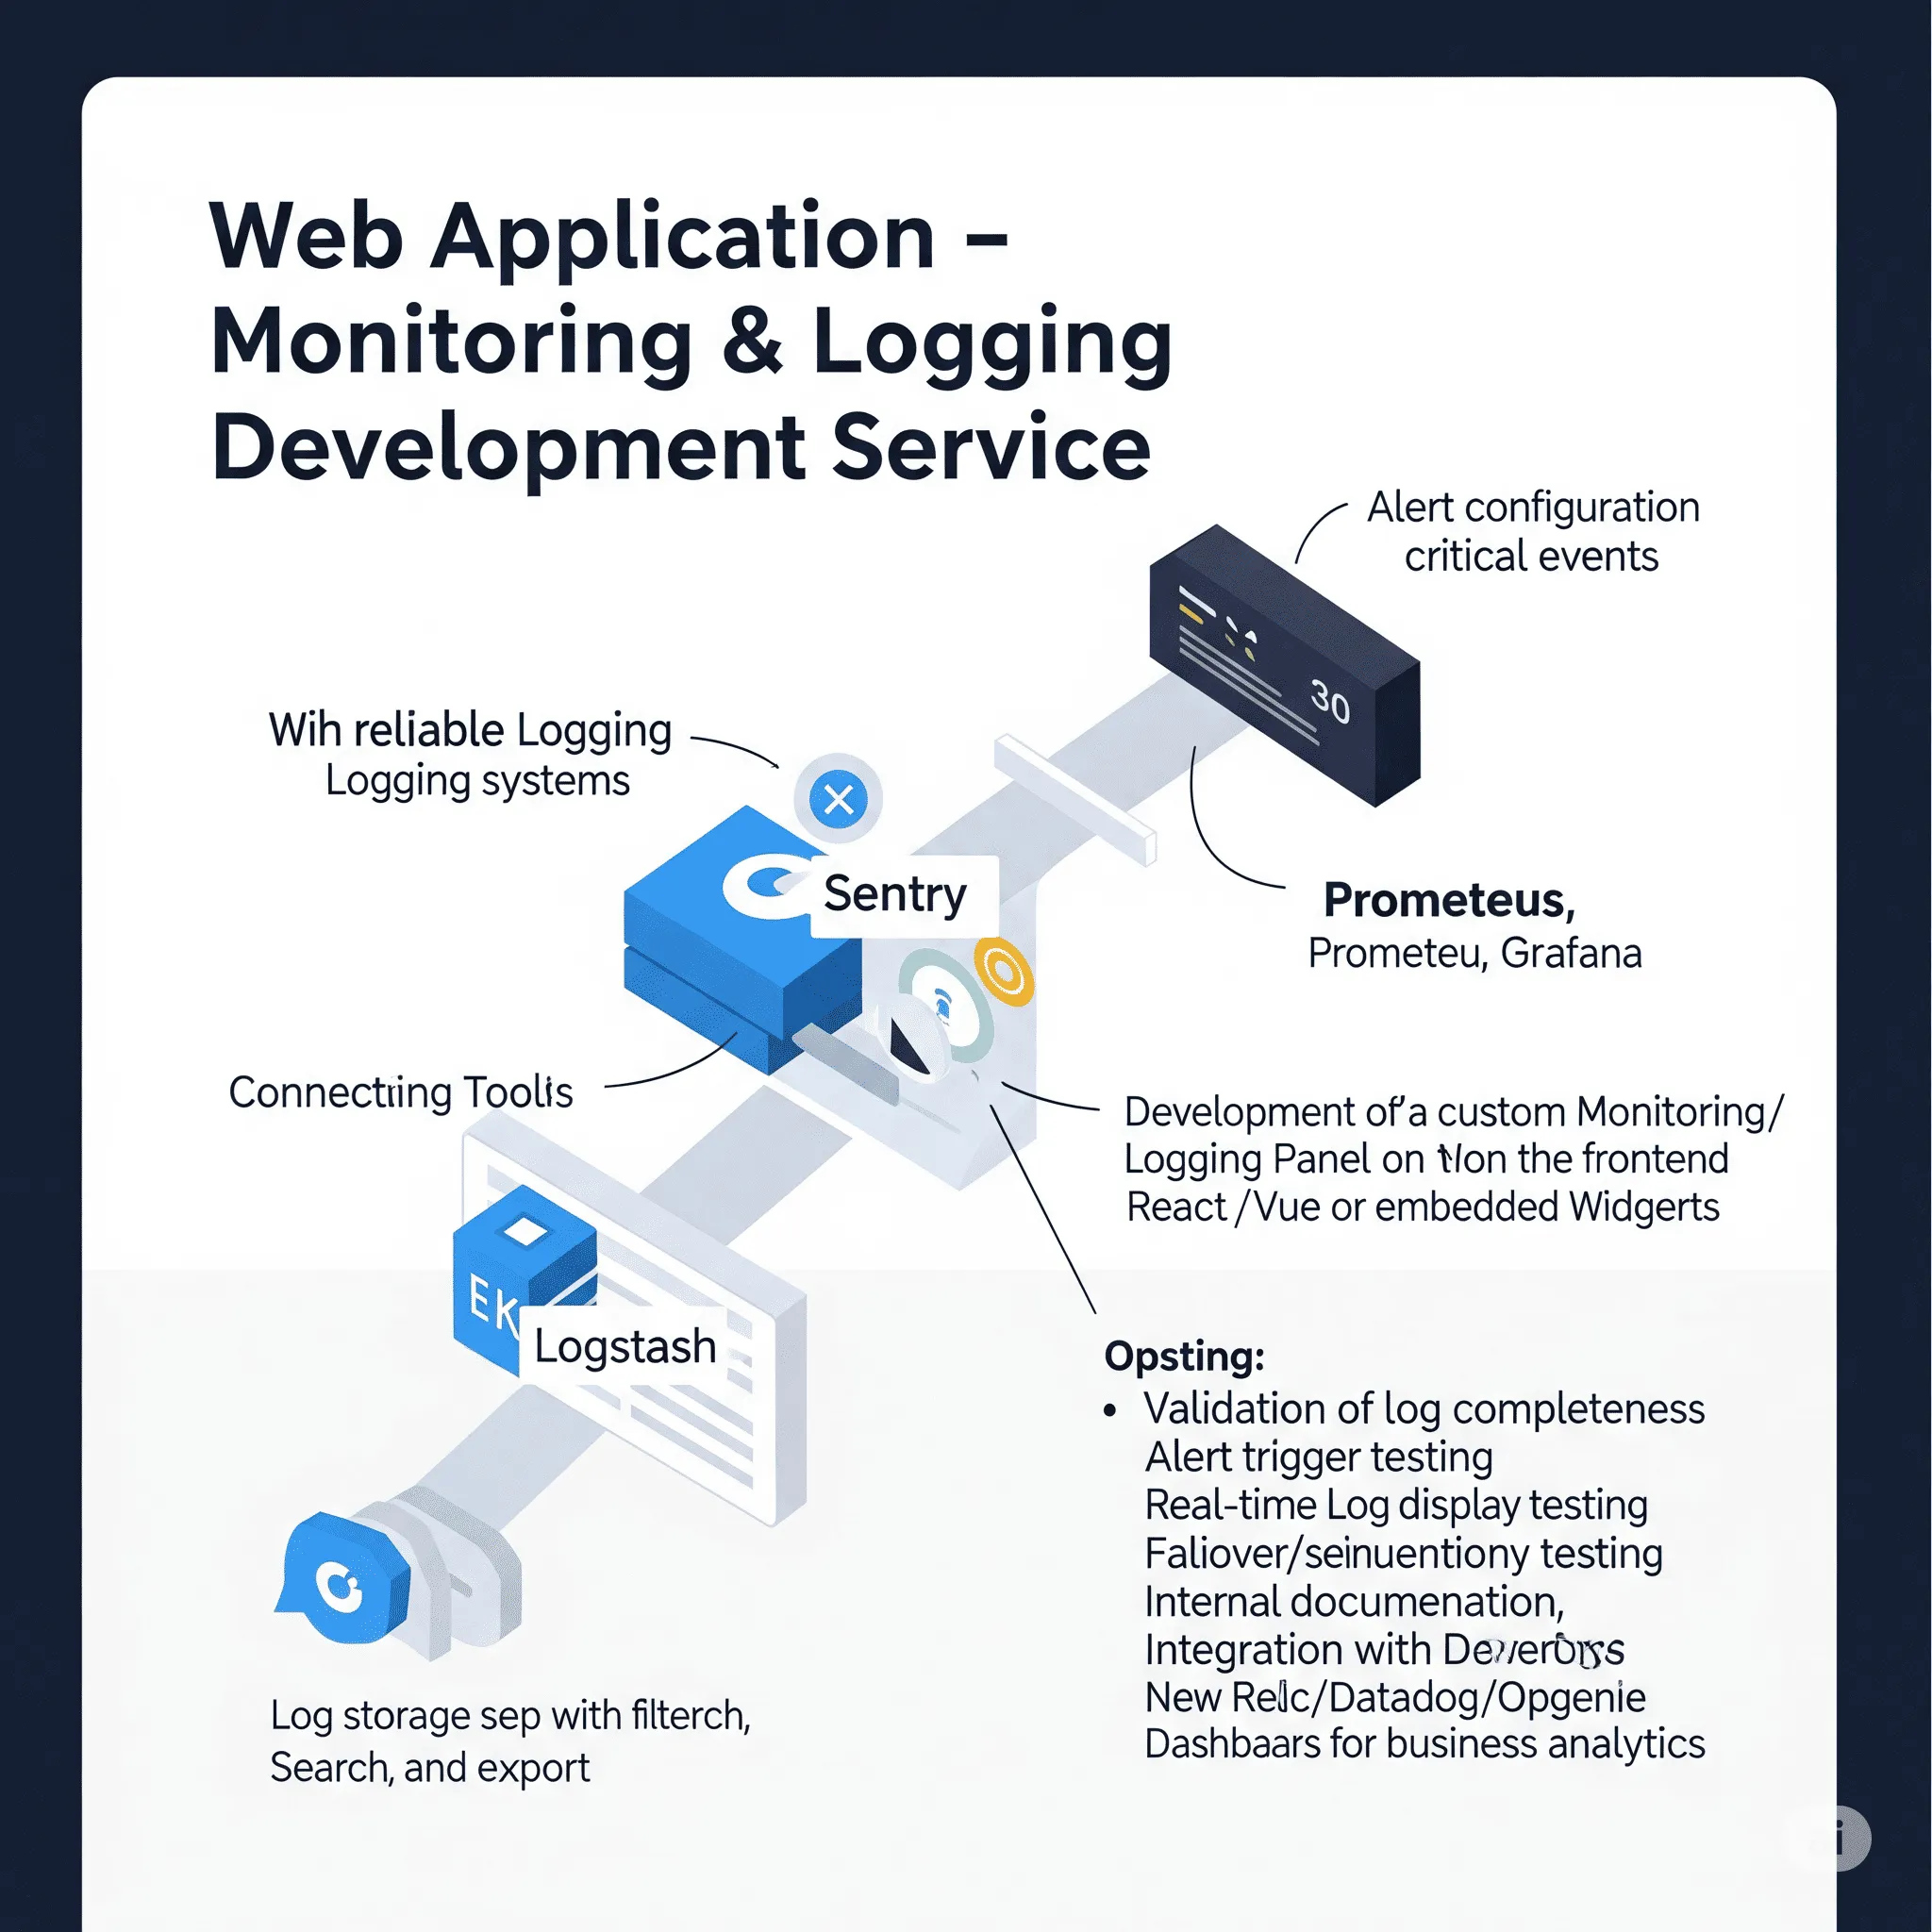
Feature goal: Implement a reliable monitoring and logging system to ensure application stability, quickly detect issues, and track key performance metrics.
🎉 Price from: $340 ($400)
You save: $60 (15%)
Rates: Junior $8–$12/h | Middle $20–$25/h | Senior $30–$40/h
Timeline: 3-7 days
You select the Monitoring & Logging module, register, and briefly describe your app architecture and desired monitoring goals. The system matches you with a developer who sets up logging, alerting, and dashboards tailored to your stack.
Certified backend and frontend freelancers (Junior, Middle, or Senior) implement the module. You can choose the level of expertise depending on your complexity, budget, and delivery speed.
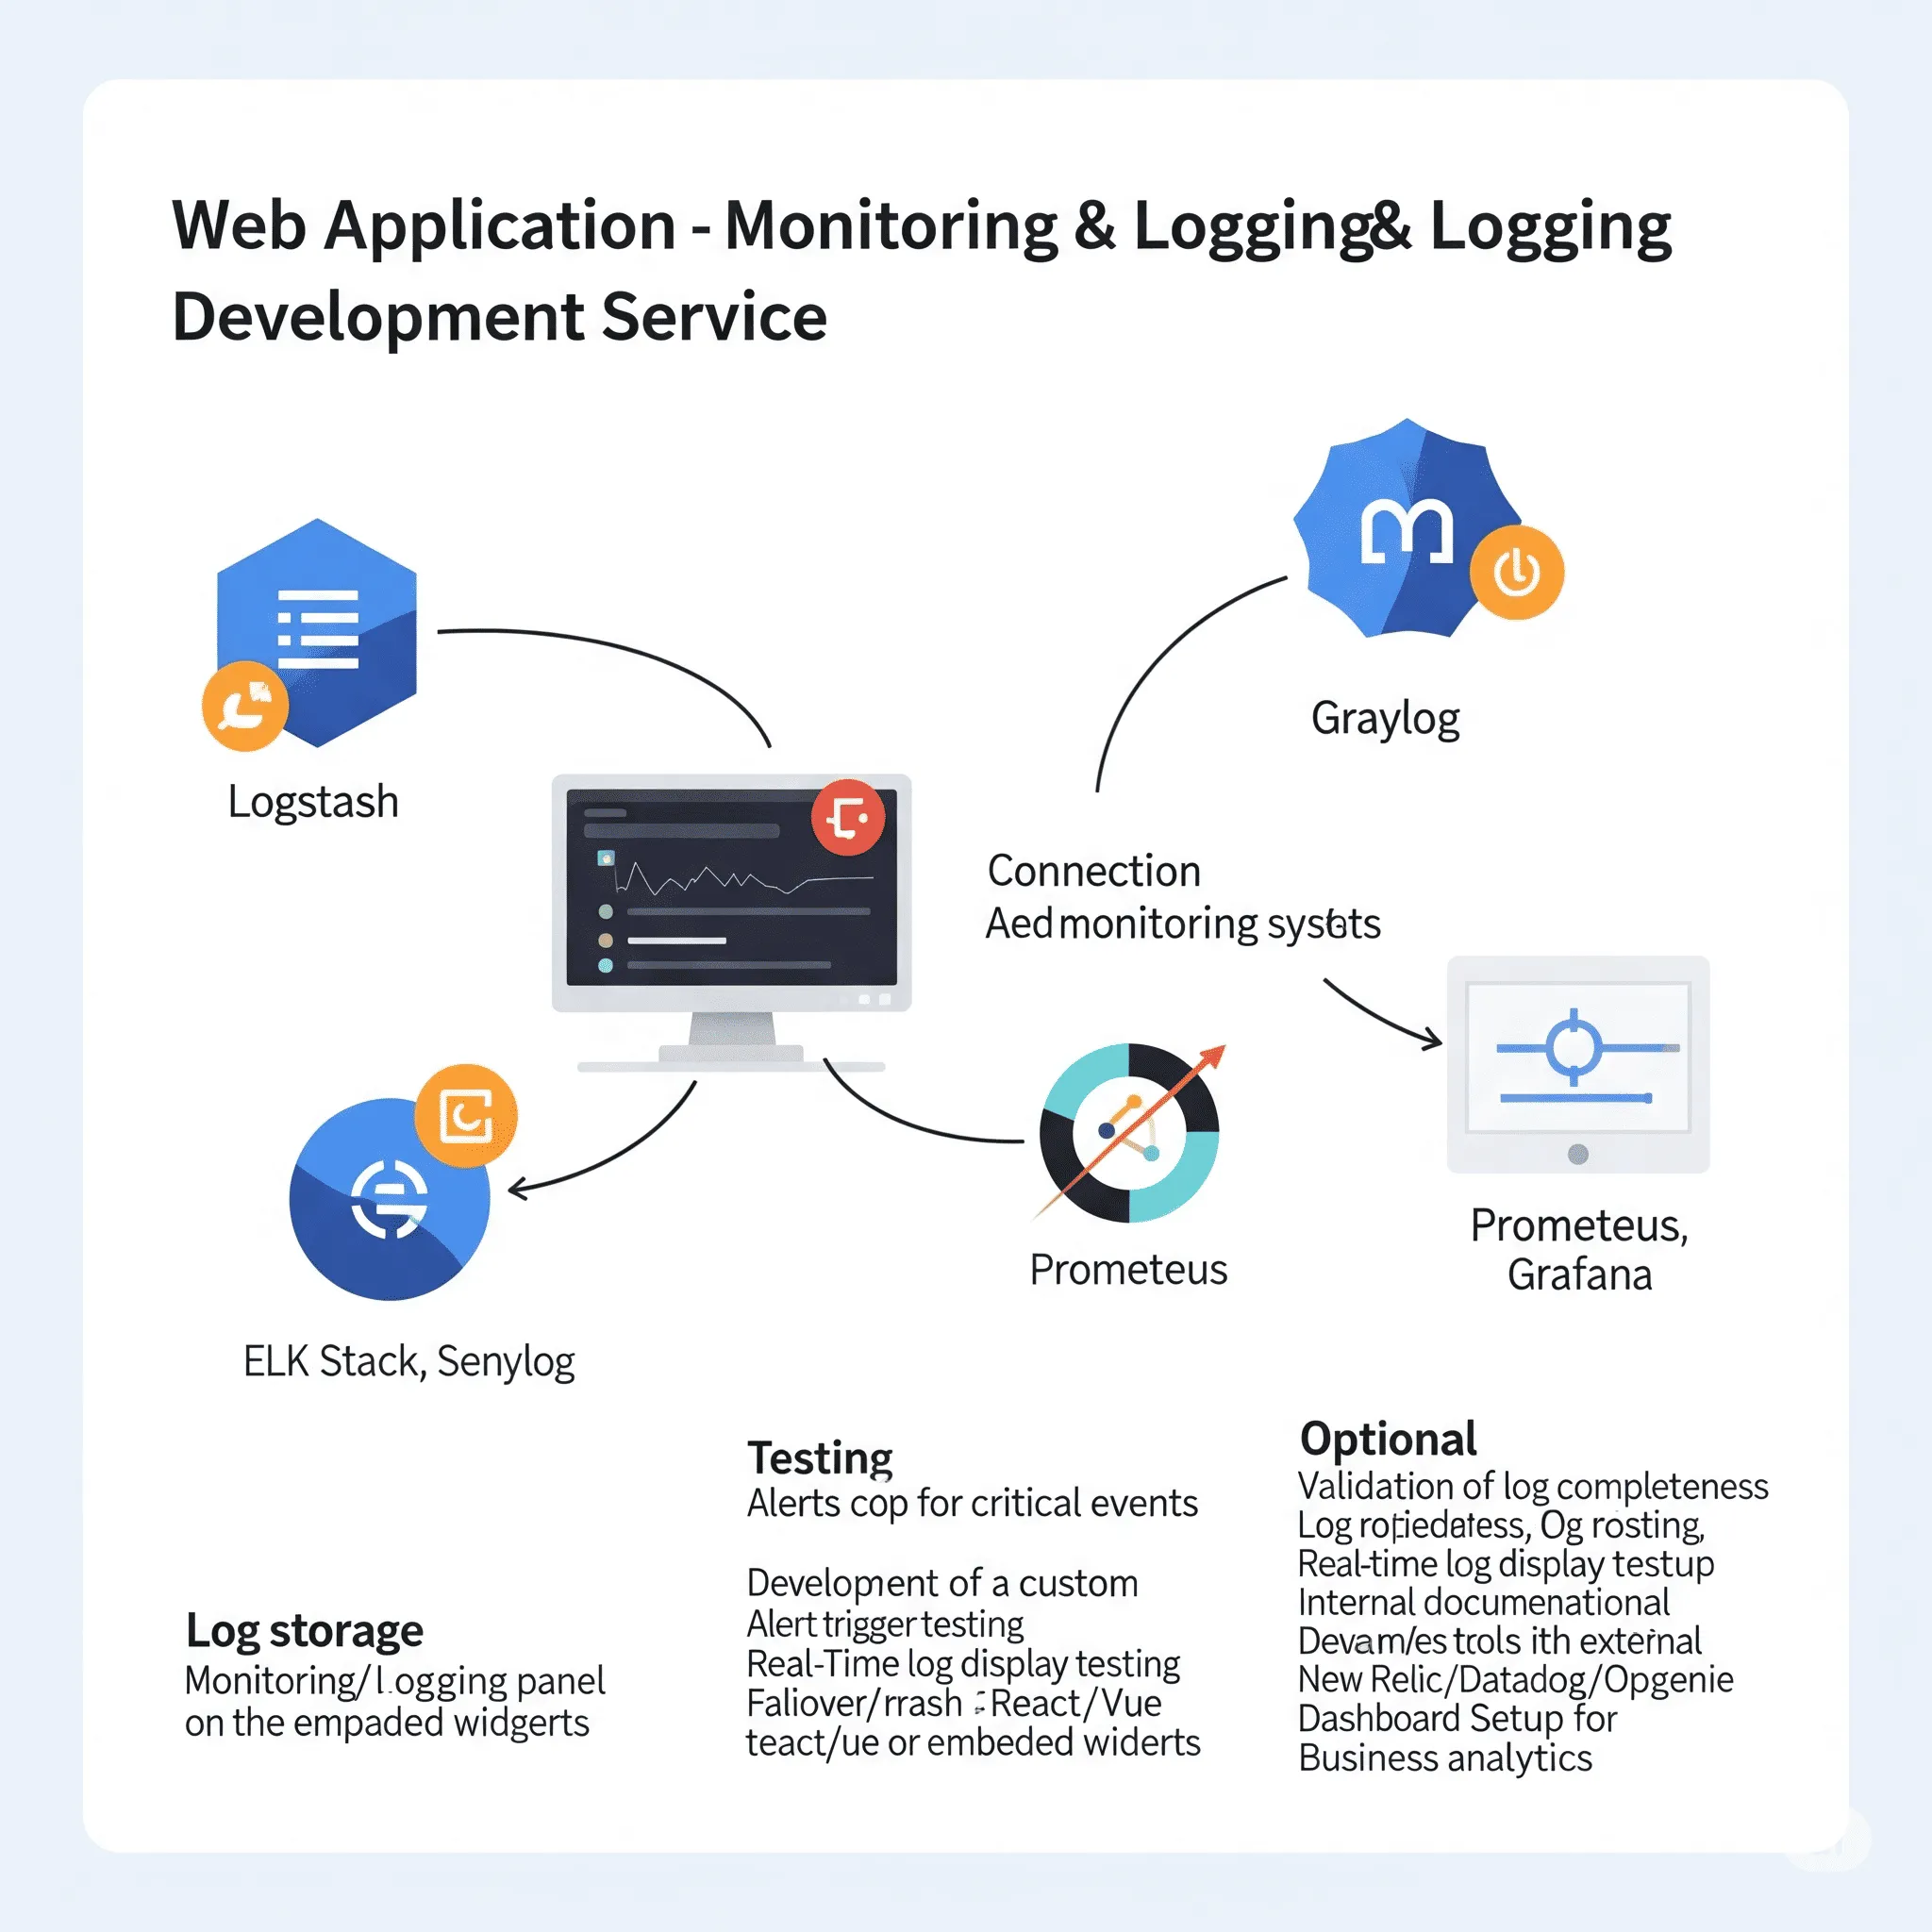
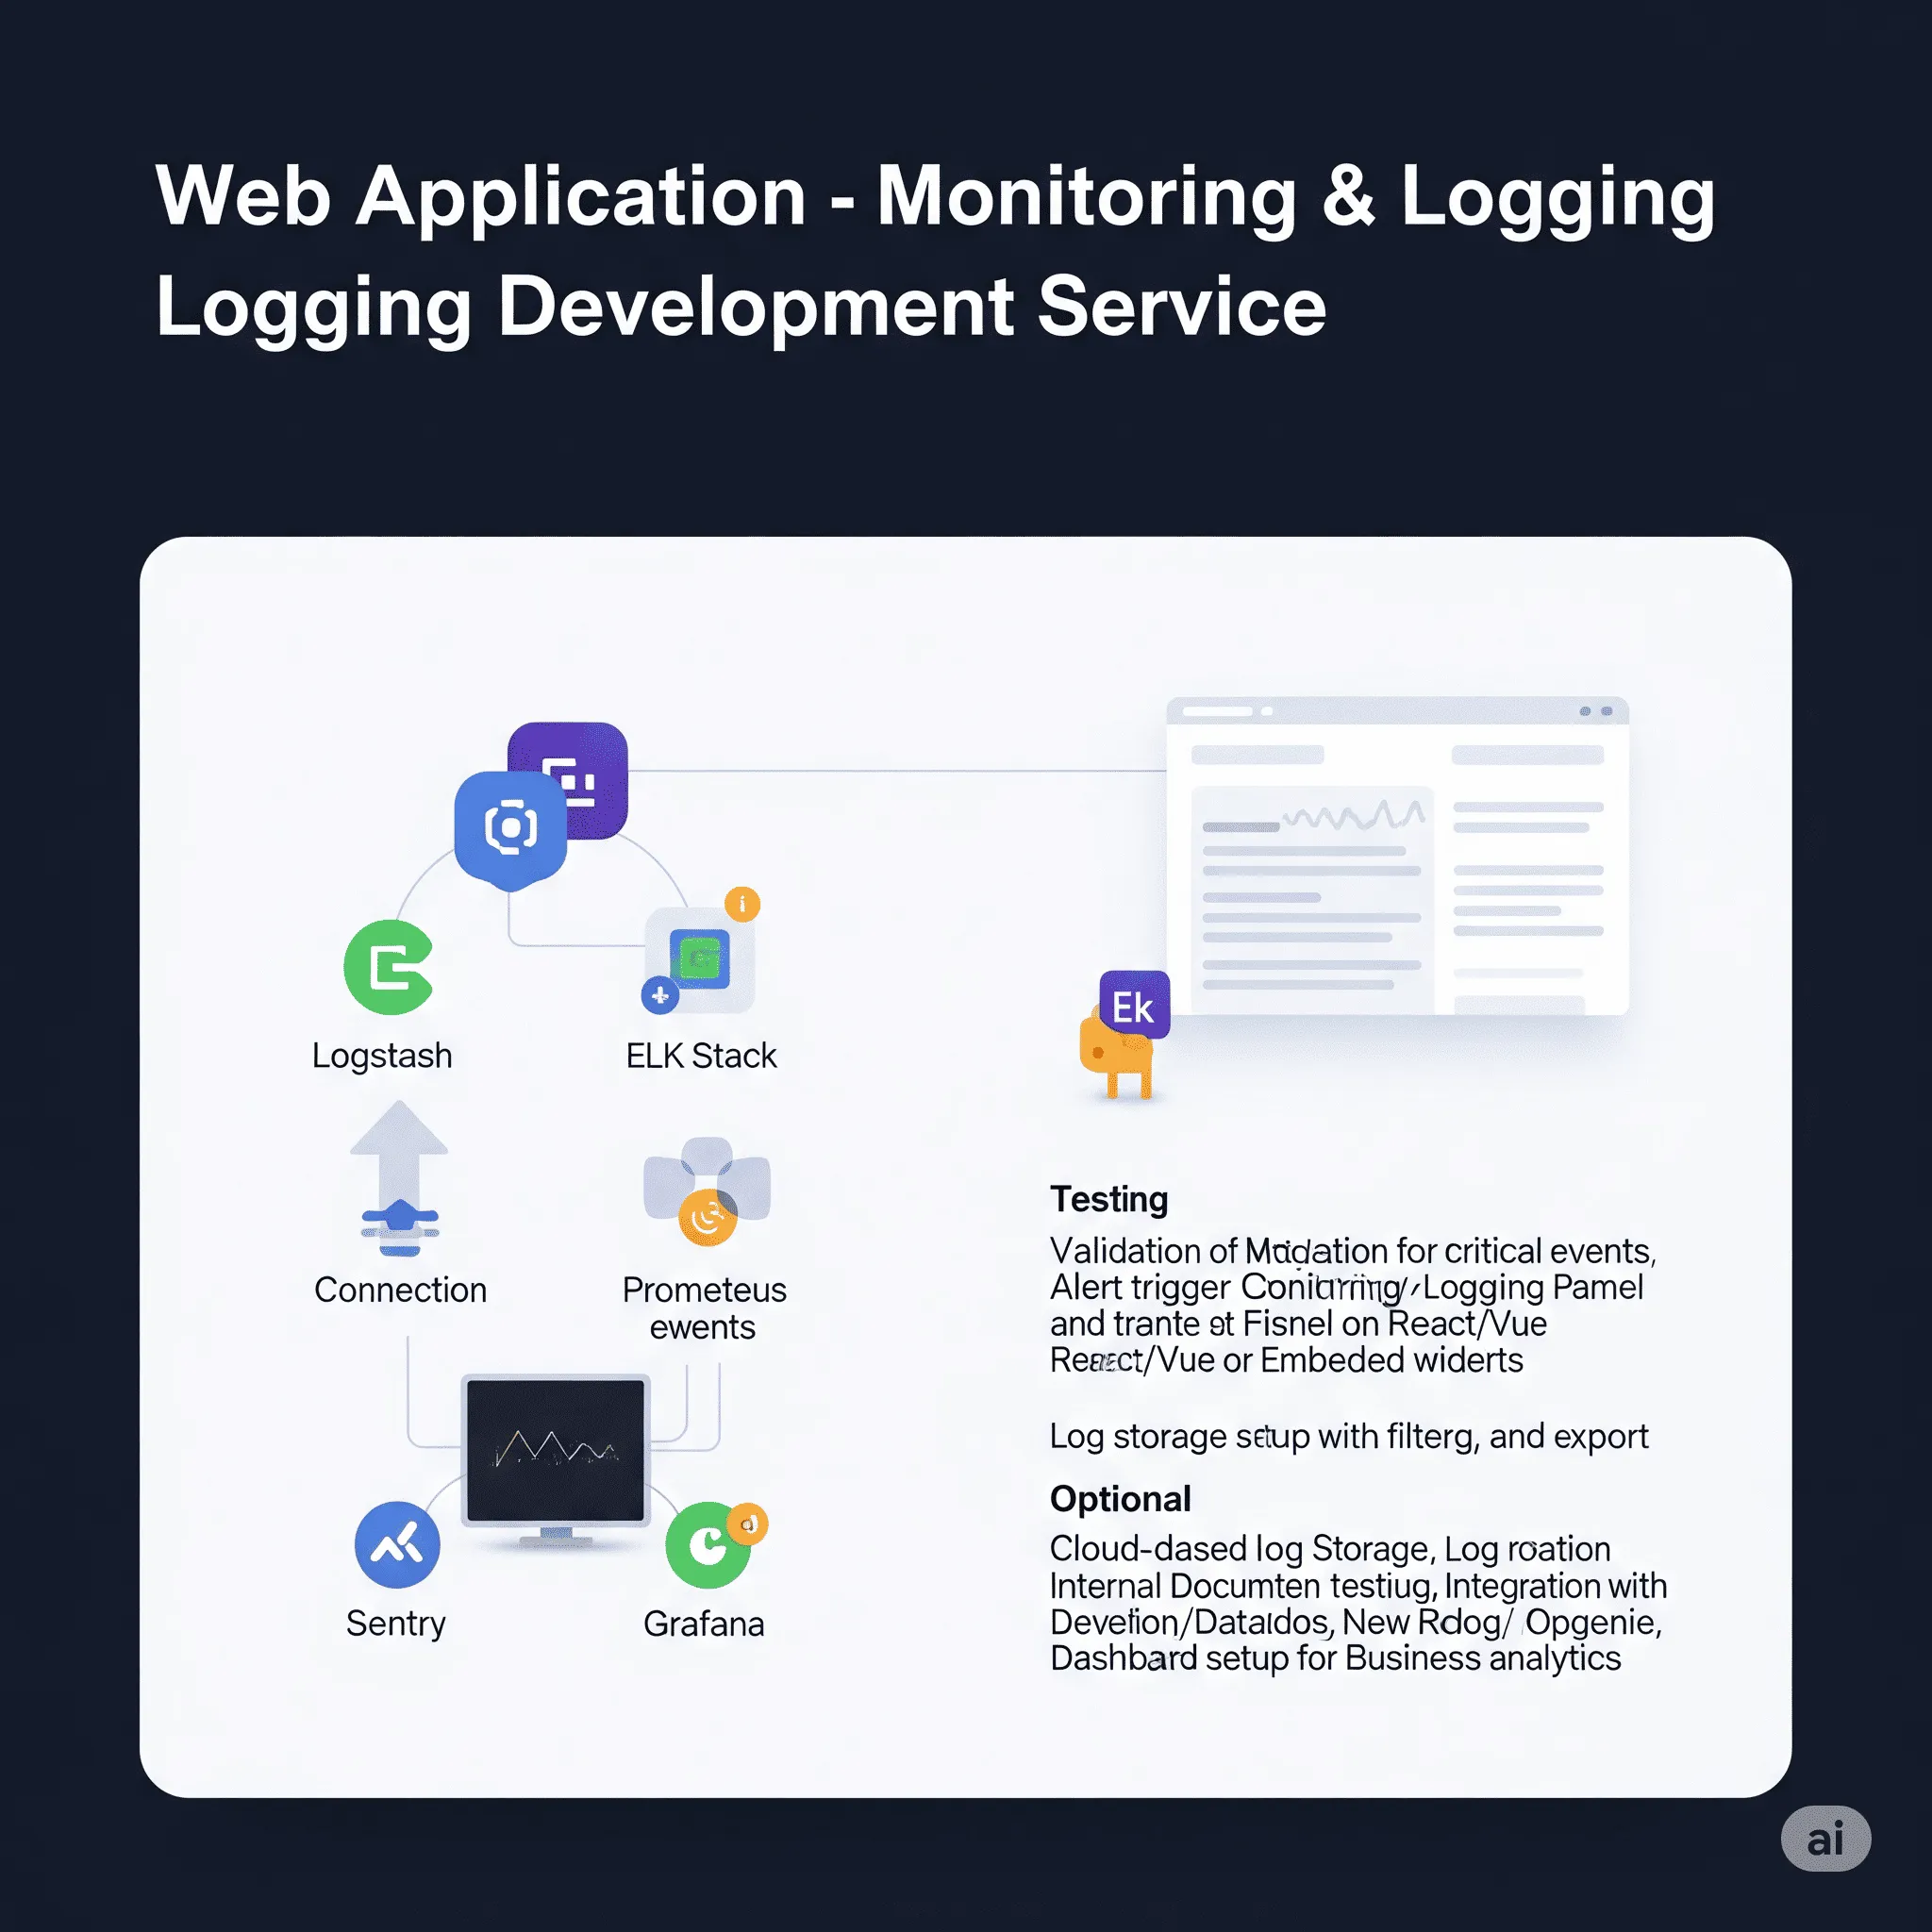
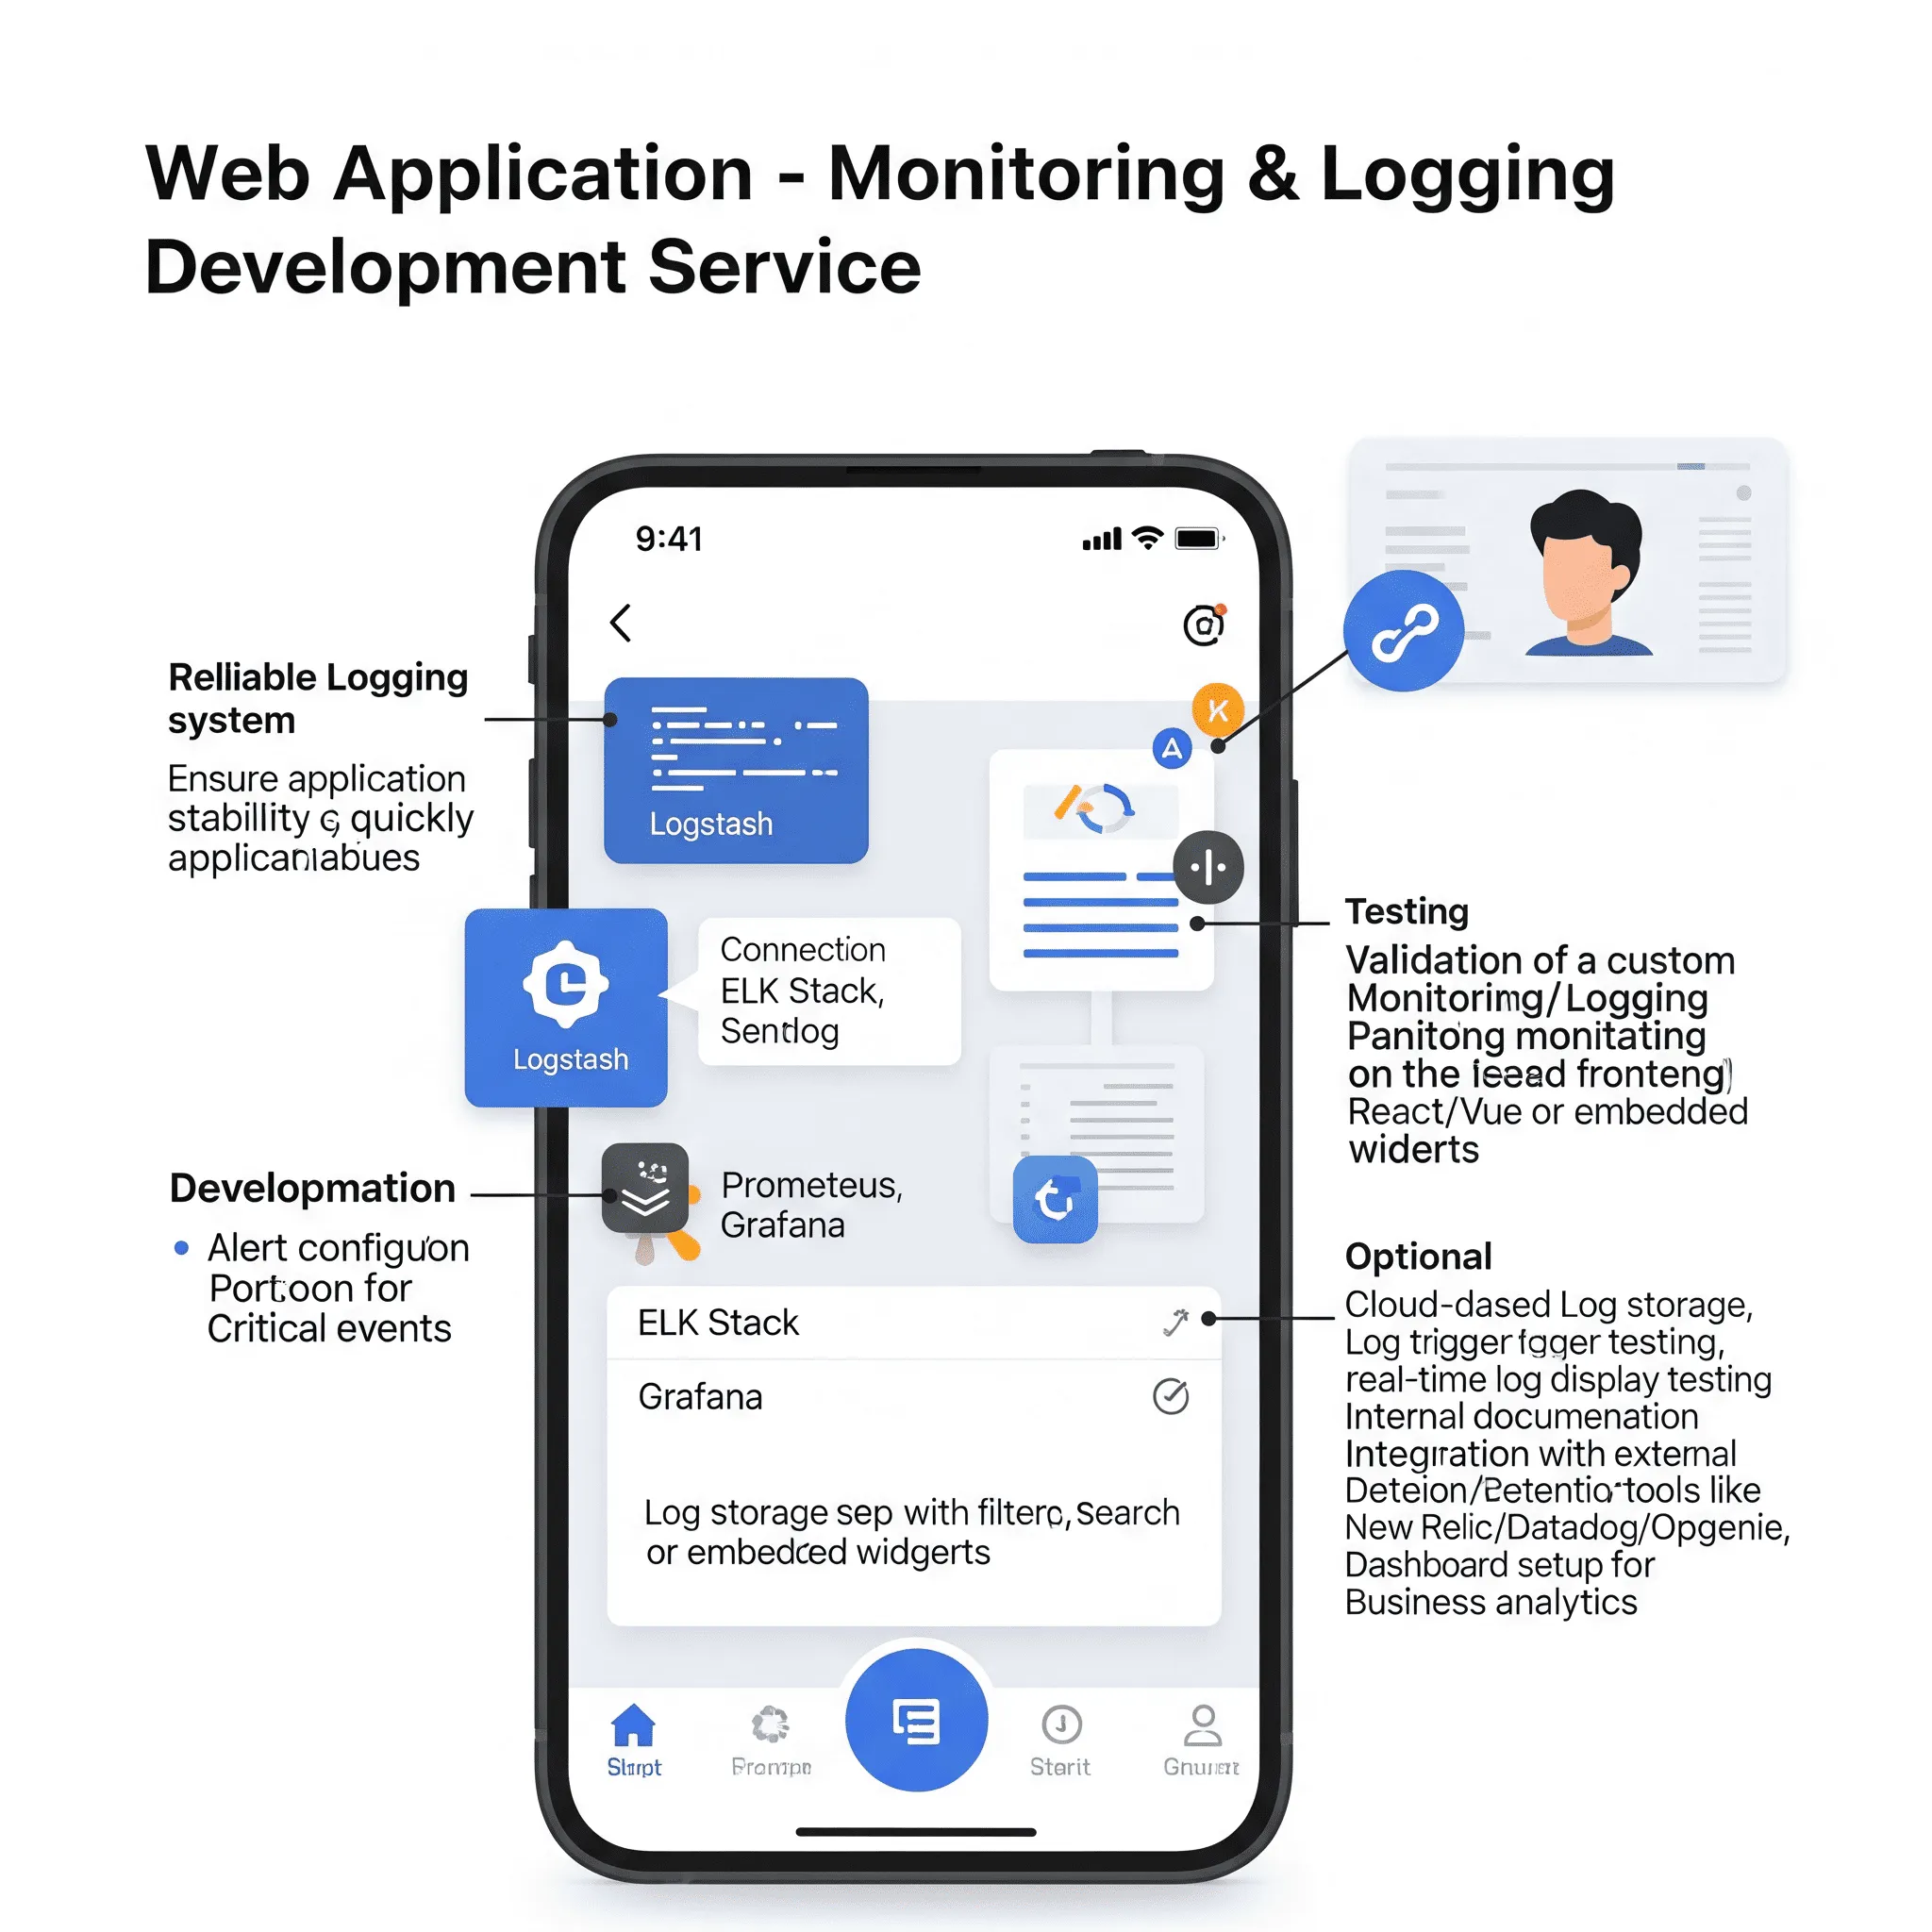
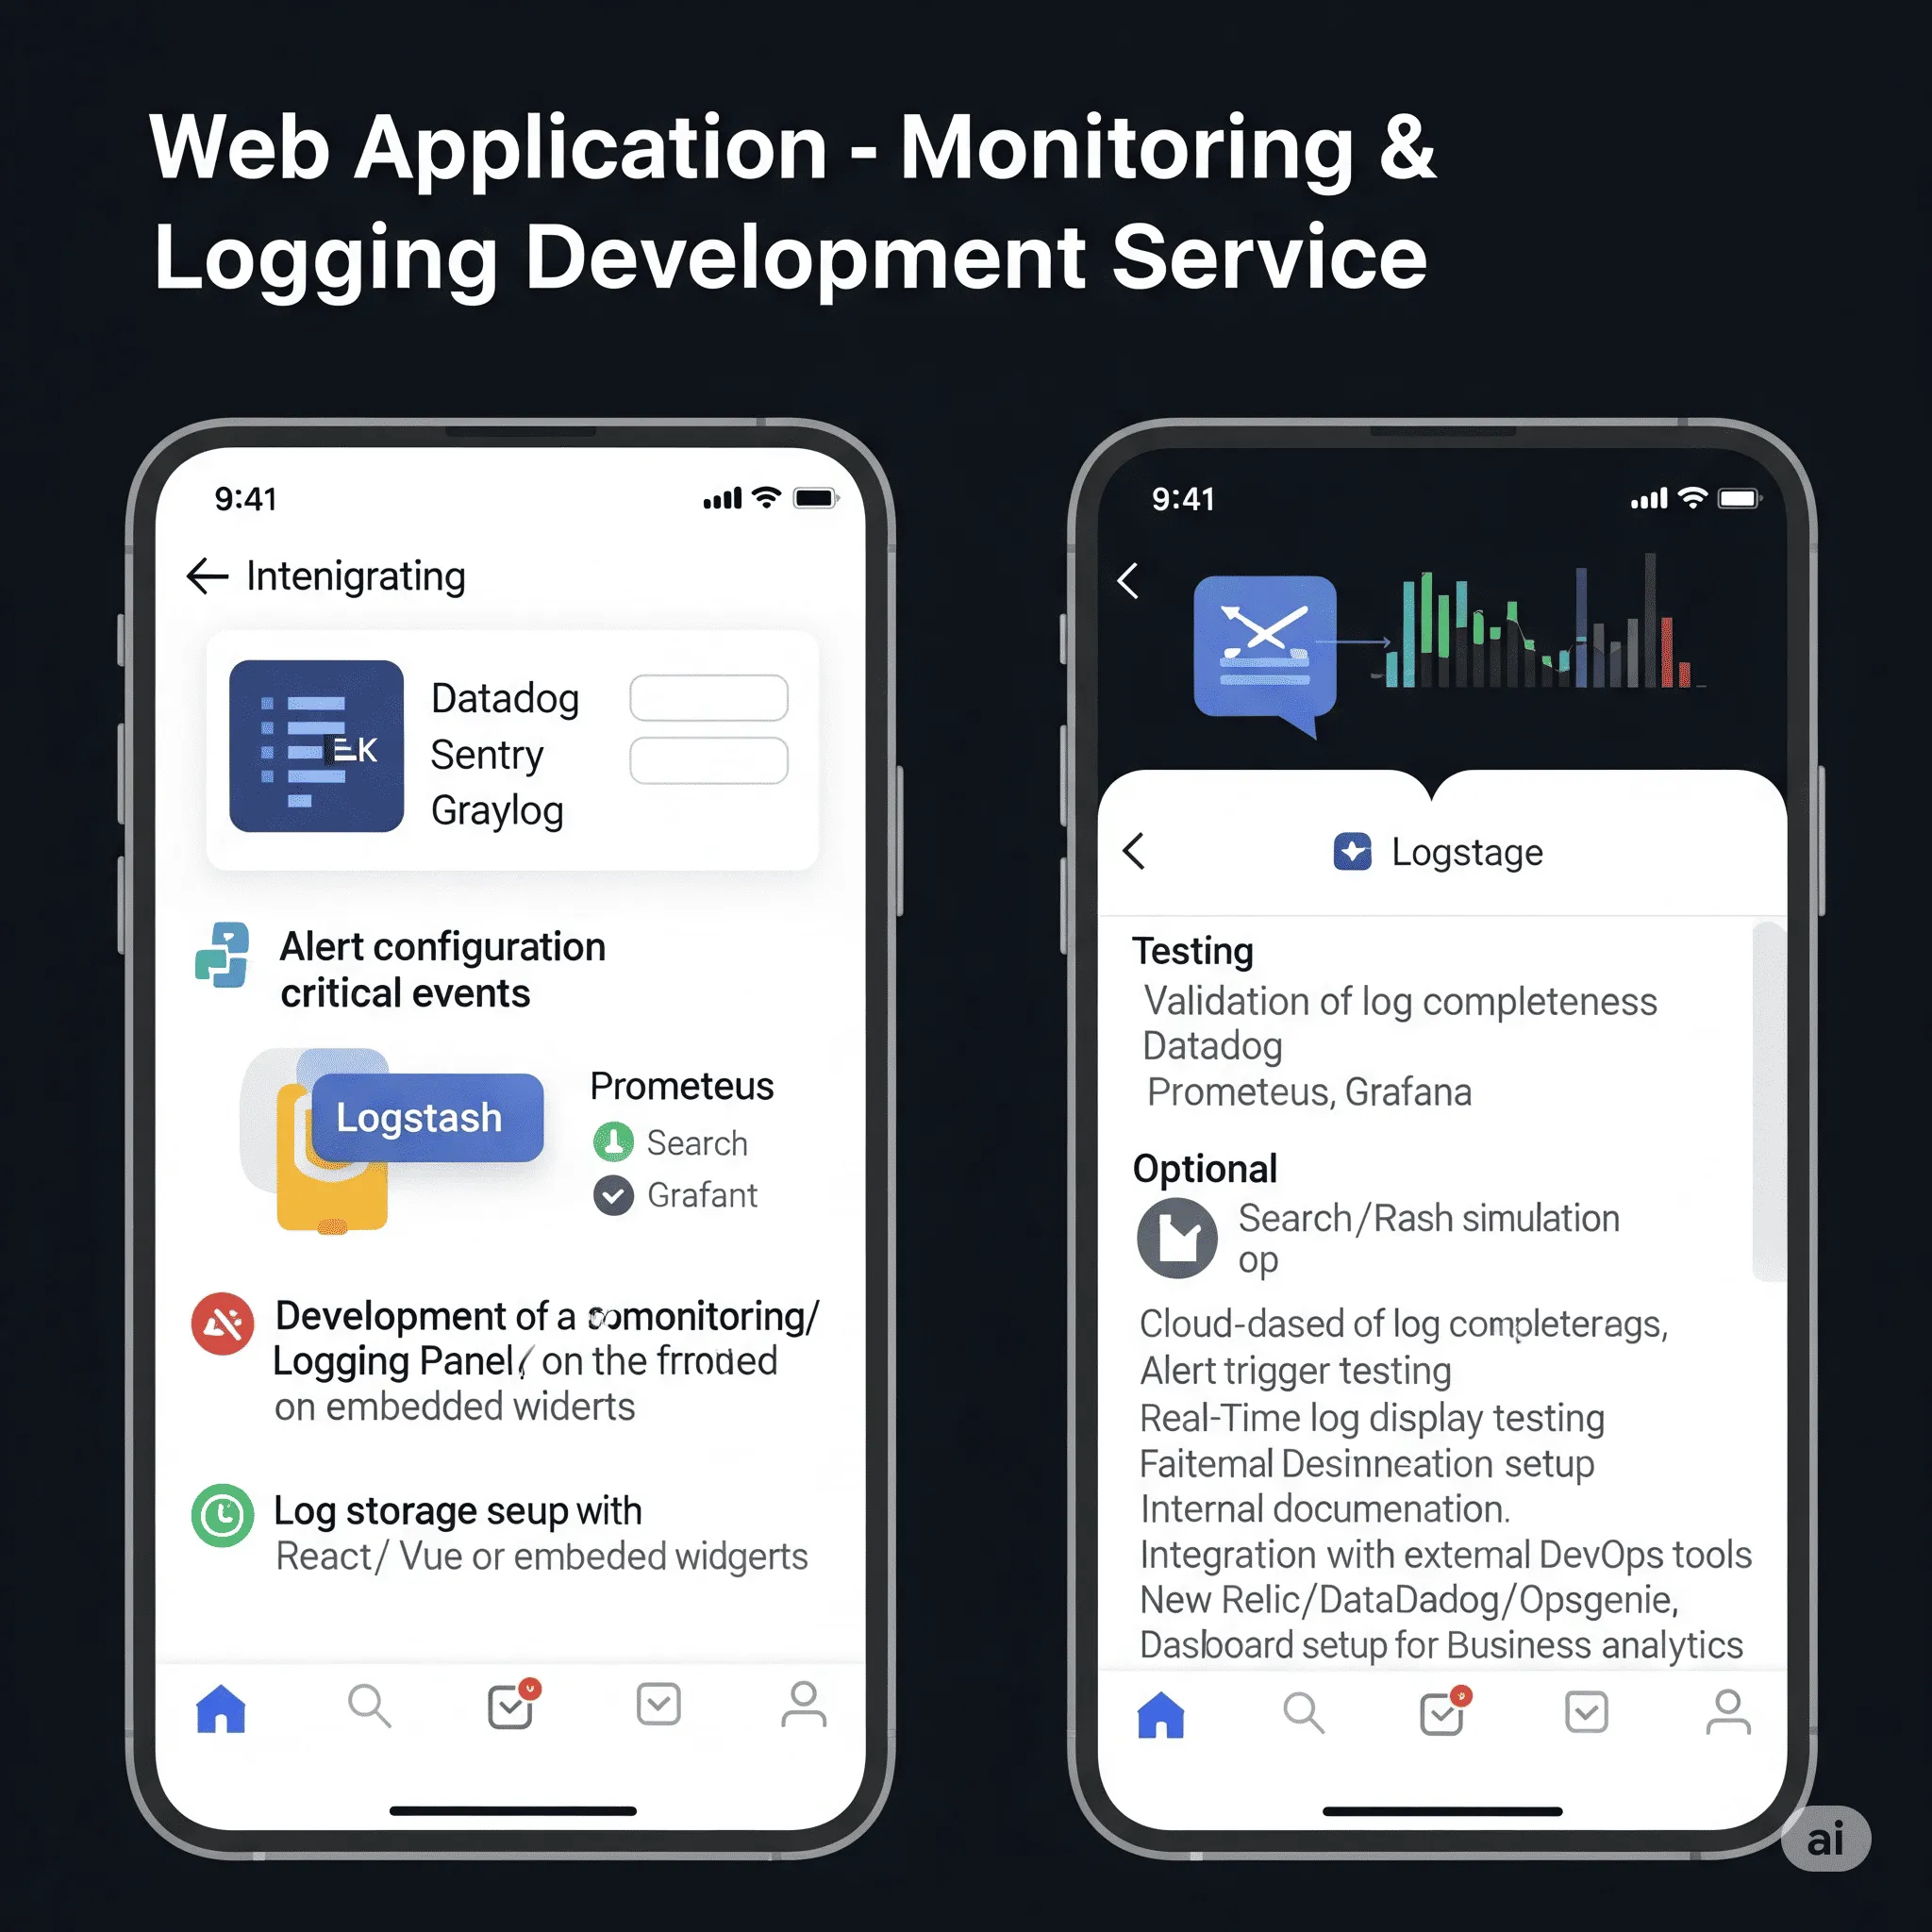
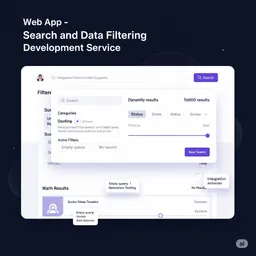
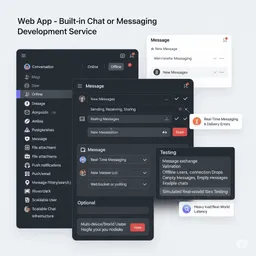
A complete monitoring setup with backend log tracking, error capture, performance metrics, and a frontend dashboard for real-time status. Includes basic alerts and test cases to ensure everything runs smoothly.
Yes. You can define what events to log, choose visualization tools (e.g., LogRocket, Sentry, Grafana), and request specific alert triggers. Custom integrations or advanced dashboards can be discussed directly with your developer.
No problem - our AI Product Manager Assistant can walk you through best practices and help create a structured brief tailored to your platform, whether it's a small MVP or a high-load web app.
Ideal for SaaS products, marketplaces, fintech platforms, and growing startups that need real-time visibility into performance and errors. This module provides full-stack monitoring, log dashboards, and custom alerts to ensure system reliability and fast issue resolution. Works with cloud-native tools, supports scaling, and is optimized for both dev and ops teams. Common clients: tech founders, CTOs, backend engineers, and DevOps teams launching or maintaining production apps. Easily integrates with existing APIs, CI/CD pipelines, and third-party observability platforms.
⚡ Limited offer — only before public launch.
Get pre-launch access to the AI Product Manager Assistant and save:
 $153
($180)
$153
($180)
 $204
($240)
$204
($240)
 $187
($220)
$187
($220)
 $136
($160)
$136
($160)
 $204
($240)
$204
($240)
Clients value this module as an essential tool for ensuring stability and visibility across their web applications. They emphasize its intuitive dashboards, real-time log tracking, and custom alerts that help identify issues before they affect users. Many appreciate how the module streamlined debugging and reduced downtime, especially during critical launches or traffic spikes. The mobile-friendly monitoring panel and quick error insights were frequently praised for enabling fast decisions on the go. Clients also highlight how seamless the integration was with their backend and CI/CD pipelines, making it a must-have for scaling applications securely and efficiently.